Java OutOfMemory: PermGen space errors are a nasty surprise that may be lurking in your freshly deployed applications. Here we look at a couple of ways to keep an eye on your PermGen usage.
If you’ve travelled any distance in the server-side Java world you’ve probably been round this block before. Your freshly minted application has been tested successfully and deployed to production and everything’s looking peachy until…
Exception in thread "main"
    java.lang.OutOfMemoryError: PermGen space
Ouch! Your live users are being affected and an army of managers are all over your ass about it. You see that OutOfMemory error and think hey, I just need more heap, right? I just need to ramp up the old -Xmx parameter on my JVM and everything will be okay.
Swing and a miss I’m afraid.
When a heap isn’t a heap
The documentation for the OutOfMemory exception contains the following:-
Thrown when the Java Virtual Machine cannot allocate an object because it is out of memory, and no more memory could be made available by the garbage collector.
But this isn’t quite the whole story because not only does the JVM use different pools of memory for different purposes but different JVM implementations manage memory in different ways and could throw this exception if, for example, a new native thread cannot be created when the operating system memory limit for the JVM process has been reached. Oracle provides some information on the more exotic causes of OutOfMemory errors here.
PermGen or Permanent generation space is used by the JVM to hold class and method objects in a totally separate ‘pool’ to the heap. Since new releases of applications tend to use ever more classes and methods, when they eventually get too big the JVM runs out of space to store them all.
The quick fix
Once you understand the nature of the problem it’s usually easy to fix. Particular JVM implementations can handle this sort of thing differently so you might need to check the documentation if you’re using something out of the mainstream, but your JVM is probably defaulting to somewhere around 80Mb of PermGen space and you can probably increase it by adding the following parameter to your launch command:-
java -XX:MaxPermSize=128M
In this example we’re adding around 50% to the available space which will probably be enough to see you through.
Quick fixes are all well and good, but you might be wondering how you can avoid the same pratfall again. If you’re interested in keeping an eye on your application’s PermGen needs, read on.
Monitoring PermGen usage with a JMX client
PermGen information is included in the details available via JMX for your JVM. Unless you have a preferred JMX client the JConsole application included in the JDK should be enough. Run it with the process ID of the JVM you want to examine (which you can get via the ps command on Unix/Linux or via Task Manager on Windows):-
jconsole 12345
Flip to the memory tab and check out the Chart drop-down list – the name of the PermGen pool differs by Platform and JVM but you’ll find something in there with the words “perm gen” in it:-
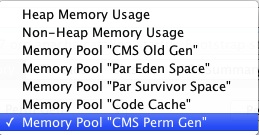
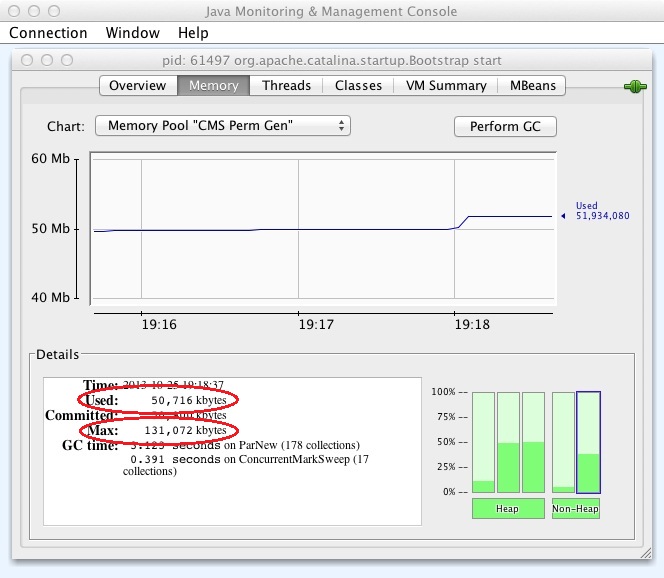
Select this entry and JConsole will show you what’s happening to your PermGen space over time along with the maximum it’s currently allowing:-
Monitoring PermGen usage from your application
If you’d prefer a thread in your application to monitor PermGen usage and perhaps alert you when trouble’s brewing you can access the same JMX information from your code.
In Java Web Apps – Running regular background tasks we looked at a simple framework for regularly executing Runnable objects in the background in a Java web application. Here’s a simple Runnable that will report the current PermGen usage to an app server log:-
import java.lang.management.ManagementFactory;
import java.lang.management.MemoryPoolMXBean;
import java.lang.management.MemoryUsage;
import java.util.Date;
import java.util.List;

public class PermGenMonitorTask
        implements Runnable {

    private MemoryPoolMXBean permgenBean = null;

    public PermGenMonitorTask() {
        List<MemoryPoolMXBean> beans =
                ManagementFactory.getMemoryPoolMXBeans();
        for(MemoryPoolMXBean bean : beans) {
            if(bean.getName().toLowerCase().indexOf("perm gen") >= 0) {
                permgenBean = bean;
                break;
            }
        }
    }

    @Override
    public void run() {
        MemoryUsage currentUsage = permgenBean.getUsage();
        int percentageUsed = (int)((currentUsage.getUsed() * 100)
                / currentUsage.getMax());
        System.out.println(new Date() + ": Permgen " +
                currentUsage.getUsed() +
                " of " + currentUsage.getMax() +
                " (" + percentageUsed + "%)");
    }
}
Our PermGen JMX bean is lurking somewhere in the list of MemoryPoolMXBeans but its name will vary from JVM to JVM, so we get the full list in our constructor and find one with “perm gen” in its name. Our run() method gets the memory usage information from the bean and writes out the current and maximum values along with the percentage used.
Oct 25, 2013 7:54:15 PM org.apache.catalina.startup.Catalina start
INFO: Server startup in 1096 ms
Fri Oct 25 19:55:15 BST 2013: Permgen 19496456 of 85983232 (22%)
Fri Oct 25 19:56:15 BST 2013: Permgen 19497328 of 85983232 (22%)
We can modify this for our deployment environment to either change the logging severity or raise alerts if the percentage used goes beyond our comfort zone.